SLA Targets
The pipeline tracks a single response-time target: first contact within 5 minutes of a new lead arriving. Everything on this page describes what the system measures, what it shows, and — as importantly — what it does not do when the target is missed.
The target
Section titled “The target”| Target | Window | Measured from | Stops when |
|---|---|---|---|
| First contact | 5 minutes | The moment the lead’s intake event lands (contact_form_submission, admin walk-in, phone entry). | The first logged outreach event of any channel (call, email, text). That outreach also moves the lead NEW → CONTACTING. |
The 5-minute number is industry-standard, not arbitrary. Response-time studies have repeatedly shown that the probability of converting a lead drops sharply after the first five minutes and again sharply after the first hour. The target codifies what the rest of the industry already knows.
What the counter on a card shows
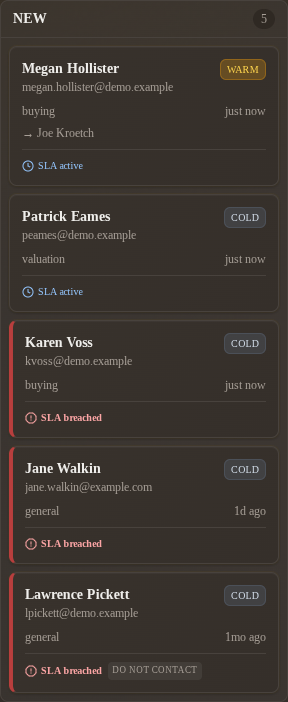
Section titled “What the counter on a card shows”A lead in NEW shows a small SLA chip on its board card and a banner on its detail page. The chip reports one of three states:
| Status | What you see | Meaning |
|---|---|---|
| Active | Green chip with remaining time ticking down — e.g. 3m 24s | The clock is running. You’re still inside the window. |
| Met | Green chip with the elapsed first-contact time — e.g. Met at 1m 47s | First outreach happened in time. The clock is frozen. |
| Breached | Red chip and red border on the card — e.g. +12m 06s | The window closed without a logged outreach. The chip shows how far past the target you are. |
The detail-page banner adds one more piece: the timestamp of first contact when the SLA has been met, so you can read the full created_at → first_outreach_at interval at a glance.
What happens at breach
Section titled “What happens at breach”This part matters more than the rest of the page: today, breaching the SLA changes how the lead is displayed, not what the system does.
| Behavior | Status today |
|---|---|
| The card’s chip turns red and the card border turns red on the board. | Shipped. |
| The detail page surfaces a red banner with the elapsed-past-target time. | Shipped. |
| The lead is reassigned to a backup agent automatically. | Not built. |
| You get an email, SMS, or push notification. | Not built. |
| Your broker gets escalated automatically. | Not built. |
| The breach event is recorded somewhere durable for reporting later. | Not built. |
The breach is visible the moment you open the board. It does not page anyone, mute anyone’s calendar, or auto-route to another agent. Nobody is woken up because Lawrence Pickett crossed 5 minutes. If the lead falls off the bottom of the board because nobody opens the board, that’s the failure mode the current implementation does not protect against.
Why visibility-only, for now
Section titled “Why visibility-only, for now”A real alerting layer needs background-job infrastructure that doesn’t yet exist on the platform. Until it does, the trade-off favored the half that works without a scheduler:
- The display half (the counter on every card, the breach indicator) needs nothing more than a page render. It works the moment you load
/admin/leads/board. - The alerting half (proactive notifications when a NEW lead crosses 5 minutes with no one watching) would need a scheduled job firing every minute against every NEW lead in every brokerage. That’s a real project.
Shipping the visible half now means the SLA is useful to anyone with the board open. Shipping the alerting half is a separate piece of work and is named explicitly in the open questions on the lifecycle reference.
How the counter is computed
Section titled “How the counter is computed”When you load a NEW card, the system reads the lead’s intake timestamp and looks for the first outreach event in its timeline. The math is the obvious one:
- No outreach event yet, less than 5 minutes elapsed → Active, with
5m − elapsedremaining. - No outreach event yet, more than 5 minutes elapsed → Breached, with
elapsed − 5mover. - At least one outreach event → Met, with the elapsed time to that first outreach.
The clock is server-rendered at request time. It does not tick on its own in the browser; refreshing the page is what advances the displayed countdown. The number you see is accurate to the moment of the load, not to the second after.
What counts as “first contact”
Section titled “What counts as “first contact””Any of the following logged events satisfies the SLA the moment it’s recorded:
| Event | Channel |
|---|---|
| Logged phone call | Voice. |
| Sent email through the platform | Email. |
| Sent SMS through the platform | SMS. |
| Recorded note describing an out-of-platform contact | Manual entry. |
What does not count:
- Opening the lead’s detail page. Reading is not outreach.
- Reassigning the lead to another agent. The new owner inherits the clock; they didn’t contact the lead.
- Setting a communication flag. Preference changes are not outreach.
If you reach a lead by phone and forget to log the call, the SLA shows red even though you did your job. Logging is what stops the clock.
What CONTACTING and beyond do to the SLA
Section titled “What CONTACTING and beyond do to the SLA”Once a lead moves out of NEW, the SLA chip stops being displayed. The 5-minute target is only about first contact; it does not regenerate for subsequent outreach. There is no “second-contact SLA,” no “qualified-within-X-days SLA,” and no recurring response target later in the pipeline.
A lead that re-enters NEW via TRASHED → NEW (bad contact info replaced with a valid one) resets the clock from the moment of the contact_info_updated event. From the SLA’s perspective, that’s a fresh inquiry.
Reading SLA history later
Section titled “Reading SLA history later”Met or breached, the first-contact timing becomes part of the lead’s permanent timeline. The intake event has the original timestamp; the first outreach event has its own. The difference between them is the historical record of how that specific lead’s SLA played out, and it stays in the timeline even after the lead is in CLOSED.
A broker who wants to see “how often did we breach this quarter?” reads it from the timeline events, not from a separate SLA log. See interpret the lifecycle dashboard for the broker-side read.
Related
Section titled “Related”- State machine card — the
NEW → CONTACTINGtransition that stops the clock - Interpret the lifecycle dashboard — what a wall of red SLA chips means at the team level
- Why event sourcing matters — why the breach event is permanent, not a transient indicator